
KEY TAKEAWAY
Loading this week’s data…
Sources: CDC FluView and CDC Respiratory Illnesses Data Channel (data through , published ); Epic Research Cosmos Communicable Diseases tracker (data through ).
Overall respiratory illness
Source: CDC Respiratory Illnesses Data ChannelFlu this week
Sources: CDC FluView + Epic ResearchOther illnesses going around
Source: Epic Research
FREE WEEKLY REPORTS
IN THE NEWS
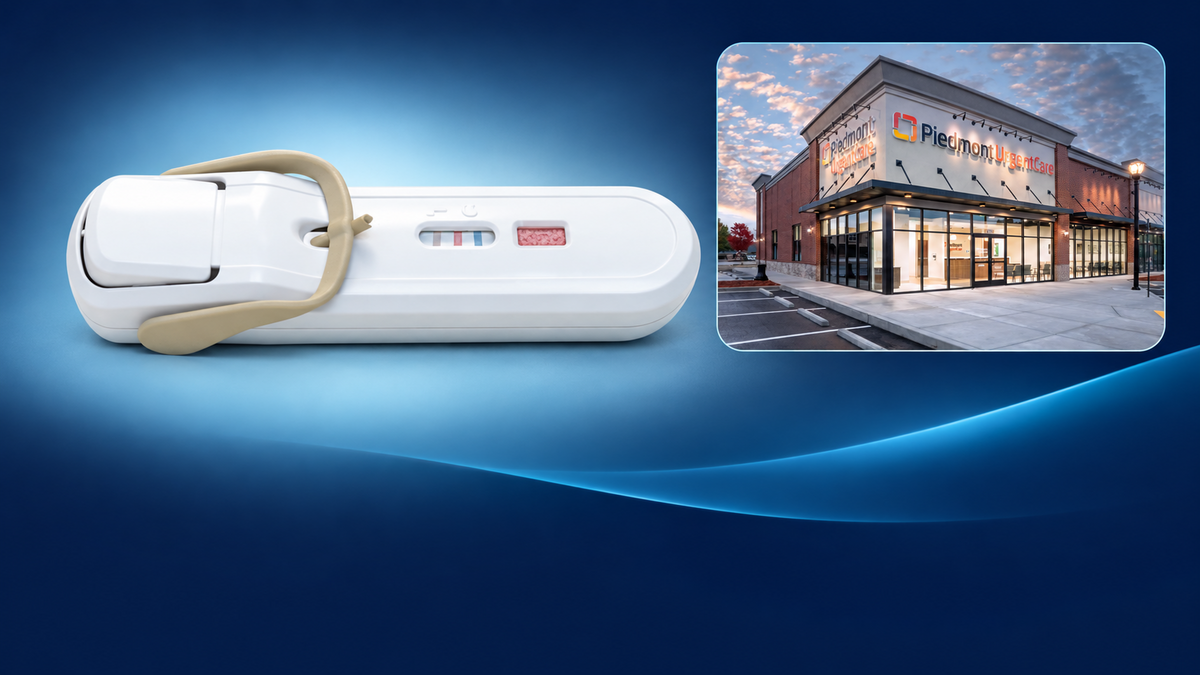 Lumos Diagnostics
Lumos expands FebriDx® adoption across WellStreet urgent care locations
Read the article
 UMC doctor explains when to choose urgent care or the ER
Read the article
 Health experts urge preparation as flu season quickly approaches
Read the article
 Flu season 2026-2027: what to know about the early rise, new H1N1 virus and the flu shot
Read the article
 Antibiotics Save Lives. But What Happens When They Stop Working?
Read the article
 Antibiotic Use and Stewardship in the United States: 2026 Update
Read the article
 More than a quarter of Americans have misrepresented symptoms to get antibiotics, surveys show
Read the article
 The US flu season is off to a very early start. It’s targeting the South and West now
Read the article
In the news this week
Follow Lumos Diagnostics on LinkedIn Lumos Diagnostics
Lumos expands FebriDx® adoption across WellStreet urgent care locations
Read the article
UMC doctor explains when to choose urgent care or the ER
Read the article
Health experts urge preparation as flu season quickly approaches
Read the article
Flu season 2026-2027: what to know about the early rise, new H1N1 virus and the flu shot
Read the article
Antibiotics Save Lives. But What Happens When They Stop Working?
Read the article
Antibiotic Use and Stewardship in the United States: 2026 Update
Read the article
More than a quarter of Americans have misrepresented symptoms to get antibiotics, surveys show
Read the article
The US flu season is off to a very early start. It’s targeting the South and West now
Read the article
Download the report
Thank you. Your report is opening in a new tab.
Open the reportACUTE RESPIRATORY INFECTIONS
Help Rule Out Bacterial Infection in Minutes* with a 99% NPV1
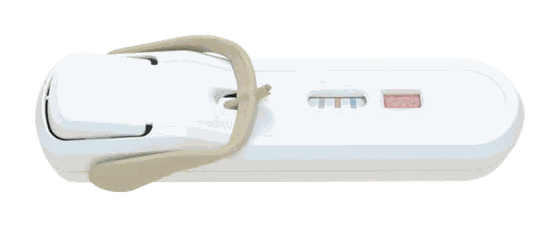
Take a new approach to cold and flu season with FebriDx®, an instrument-free, CLIA-waived fingerstick test.
It delivers clear, objective results that support diagnoses and helps improve communication with patients during respiratory visits.
Learn more about FebriDx →
99% Negative Predictive Value (NPV)
for bacterial infection1
Results in Minutes*
from a simple 5 µL fingerstick1
Instrument-Free
No additional equipment required
Reimbursement Code
PLA code 0442U2
MxA + CRP
dual-biomarker technology3